Market Outlook
May 18, 2017
Market Cues
Domestic Indices
Chg (%)
(Pts)
(Close)
Indian markets are likely to open negative tracking the SGX Nifty and Global
BSE Sensex
0.2
76
30,659
markets .
Nifty
0.1
14
9,526
The US markets closed sharply lower during the day. The Dow Jones tumbled 373
Mid Cap
(0.0)
(3)
15,077
points one of the biggest fall in nearly one year, while the Tech heavy NASADQ fell
Small Cap
(0.2)
(29)
15,681
by 158 points. The sell off on Wall Street Came as ongoing political turmoil in
Washington further offset optimism about President Donald Trump's ability to
Bankex
0.1
25
26,084
implement tax reforms and deregulation. Financial stocks were under pressure
during the day and the Dow Jones Banks Index fell 4%. Also considerable weakness
Global Indices
Chg (%)
(Pts)
(Close)
was visible in the semiconductor stocks
Dow Jones
(1.8)
(373)
20,607
The European markets also ended the day in negative territory. The markets began
Nasdaq
(2.6)
(158)
6,011
the day in red but accelerated lower in the afternoon due to weak opening in the
FTSE
(0.3)
(18)
7,504
Wall Street. Financials and cyclical stocks were the hardest hit during the day.
Nikkei
(0.5)
(105)
19,815
Investor’s sentiment was negatively impacted by the growing political turmoil in the
Hang Seng
(0.2)
(42)
25,294
United States
Shanghai Com
(0.3)
(9)
3,104
Indian markets continued their upward journey hitting new highs. Renewed hope of
rate cuts by RBI helped buying interest in the banking stocks while a stellar
Advances / Declines
BSE
NSE
performance by Tata Steel changed the sentiment for the metal space.
In major policy announcement the Govt back home approved the coal linkage
Advances
1,270
1,697
auction policy to ensure adequate supply of fuel to the power plants. This should
Declines
1,547
957
bring in fresh buying interest in stocks related to the power sector.
Unchanged
169
85
News Analysis
Volumes (` Cr)
Cabinet approves new Coal linkage policy
BSE
6,808
Detailed analysis on Pg2
NSE
25,763
Investor’s Ready Reckoner
Key Domestic & Global Indicators
#Net Inflows (` Cr)
Net
Mtd
Ytd
Stock Watch: Latest investment recommendations on 150+ stocks
FII
(1,044
( 3,748
45,760
Refer Pg6 onwards
MFs
8230
2,591
23,273
Top Picks
CMP
Target
Upside
Top Gainers
Price (`)
Chg (%)
Company
Sector
Rating
(`)
(`)
(%)
Tatasteel
493
8.0
Blue Star
Capital Goods
Accumulate
672
760
13.1
Ceatltd
1,832
7.9
Dewan Housing Fin. Financials
Buy
429
520
21.2
Mahindra Lifespace Real Estate
Accumulate
456
522
14.5
Welcorp
94
4.7
Navkar Corporation Others
Accumulate
237
265
11.9
Sobha
430
4.3
KEI Industries
Capital Goods
Accumulate
220
239
8.4
Rtnpower
9
3.9
More Top Picks on Pg4
Key Upcoming Events
Top Losers
Price (`)
Chg (%)
Previous
Consensus
Date
Region
Event Description
Edelweiss
179
(5.7)
Reading
Expectations
Shreecem
18,858
(5.5)
May 18, 2017 Euro Zone Euro-Zone Consumer Confidence
(3.60)
(3.00)
May 18, 2017 US
Initial Jobless claims
236.00
240.00
Pnb
165
(5.4)
May 19, 2017 Germany GDP nsa (YoY)
2.90
Religare
183
(4.6)
May 23, 2017 Germany PMI Manufacturing
58.20
Andhrabank
68
(4.2)
May 23, 2017 US
New home sales
621.00
625.00
#As on May 17, 2017
May 24, 2017 Germany PMI Services
55.40
Market Outlook
May 18, 2017
News Analysis
Cabinet approves new coal linkage policy
In a major breather to the thermal power sector, the Union Cabinet approved the
long languishing coal linkage policy. The new policy aims to assure long term coal
linkages to the power plants of combined capacity of 30,000 MW which were
awaiting fuel supply. Major beneficiaries in private sector would be Reliance
Power, Adani Power, Bajaj Hindustan, Lanco, Jindal Power, CESC, KSK Energy etc.
the new policy, coal linkages would be awarded to designated state-owned power
distribution companies (discoms). These discoms in turn will assign these linkages
to state/central generation companies via allocation and by auction method to
privately-owned units.
The policy was languishing for over a year now to build wide consensus as several
stakeholders were involved. Out of the planned 1.08 lakh MW power generation
post-2009, coal demand for 78,000 MW is being met. Coal India is meeting 67%
coal demand of these plants, which will increase to 90 per cent this fiscal; fiscal.
Besides the 78,000 MW, close to 30,000 MW is still awaiting any sort of
allocation. Out of this 30,000 MW, 20,000 MW plants would come soon and are
without any PPAs. In these upcoming projects, 14,000 MW are privately owned.
The approval of coal linkage policy by the CCEA is a welcome move for the power
sector. Thermal power generation capacity i.e. 221GW represents India’s 67% of
the total power generation capacity. Of this, coal based capacity works out to be
88% indicating lions share in overall capacity, so the new coal linkage policy is
likely to be positive for the sector. The plant load factors of Indian thermal power
stations have been going down gradually over last few years due to the coal
supply constraints. We believe that the coal linkage policy will ensure the long term
fuel supply for the power stations which will help in bringing more operational
efficiency in sector.
Economic and Political News
Drug Firms faces NNPA heat over violating price norms
PM Narendra Modi to visit Germany, Spain and Russia from May 29
McKinsey pegs provisioning requirement of banks at `6lakh cr.
Corporate News
HUL posts good set of results for Q4FY17 with PAT at `1,183cr
Infosys to hire nearly 20,000 from campuses
JSW Steel Q4FY17 PAT up three fold at `1,009cr
Allahabad Bank posts PAT of `111cr in Q4FY17
Market Outlook
May 18, 2017
Quarterly Bloomberg Brokers Consensus Estimate
Bank of Baroda - May 18, 2017
Particulars ( ` cr)
4QFY17E
4QFY16
y-o-y (%)
3QFY17
q-o-q (%)
Net profit
500
(3,230)
115.5
253
97.8
Bajaj Auto Ltd - May 18, 2017
Particulars ( ` cr)
4QFY17E
4QFY16
y-o-y (%)
3QFY17
q-o-q (%)
Net sales
4,797
5,304
(10)
4,976
(4)
EBITDA
958
1,152
(17)
1,044
(8)
EBITDA margin (%)
20
22
21
Net profit
842
803
5
925
(9)
Cummins India Ltd - May 18, 2017
Particulars ( ` cr)
4QFY17E
4QFY16
y-o-y (%)
3QFY17
q-o-q (%)
Net sales
1,268
1,038
22.2
1,324
(4.2)
EBITDA
209
171
22.1
226
(7.9)
EBITDA margin (%)
16.4
16.5
17.1
Net profit
197
164
19.7
198
(0.8)
Tata Power Co Ltd Consol - May 19, 2017
Particulars ( ` cr)
4QFY17E
4QFY16
y-o-y (%)
3QFY17
q-o-q (%)
Net sales
7,135
9,375
(23.9)
6,678
6.8
EBITDA
1,620
1,913
(15.3)
1,403
15.5
EBITDA margin (%)
22.7
20.4
21.0
Net profit
476
360
32.3
599
(20.5)
Grasim Industries Ltd Consol - May 19, 2017
Particulars ( ` cr)
4QFY17E
4QFY16
y-o-y (%)
3QFY17
q-o-q (%)
Net sales
10,152
9,896
2.6
8,495
19.5
EBITDA
531
2,002
(73.5)
1,712
(69.0)
EBITDA margin (%)
5.2
20.2
20.1
Net profit
849
696
21.9
728
16.5
Motherson Sumi Systems Consol - May 19, 2017
Particulars ( ` cr)
4QFY17E
4QFY16
y-o-y (%)
3QFY17
q-o-q (%)
Net sales
11,137
10,068
10.6
10,514
5.9
EBITDA
1,235
1,064
16.1
1,075
14.9
EBITDA margin (%)
11.1
10.6
10.2
Net profit
462
414
11.6
416
11.0
Market Outlook
May 18, 2017
Top Picks ★★★★★
Market Cap
CMP
Target
Upside
Company
Rationale
(` Cr)
(`)
(`)
(%)
Strong growth in domestic business due to its leadership
in acute therapeutic segment. Alkem expects to launch
Alkem Laboratories
22,754
1,903
2,257
18.6
more products in USA, which bodes for its international
business.
We expect the company would report strong profitability
Asian Granito
1,162
386
405
4.9
owing to better product mix, higher B2C sales and
amalgamation synergy..
Favourable outlook for the AC industry to augur well for
Cooling products business which is out pacing the market
Blue Star
6,422
672
760
13.1
growth. EMPPAC division's profitability to improve once
operating environment turns around..
With a focus on the low and medium income (LMI)
consumer segment, the company has increased its
Dewan Housing Finance
13,434
429
520
21.2
presence in tier-II & III cities where the growth opportunity
is immense.
Strong loan growth backed by diversified loan portfolio
and adequate CAR. ROE & ROA likely to remain decent
Equitas Holdings
5,606
166
235
41.6
as risk of dilution remains low. Attractive valuations
considering growth.
Economic recovery to have favourable impact on
advertising & circulation revenue growth. Further, the
Jagran Prakashan
6,211
190
225
18.4
acquisition of a radio business (Radio City) would also
boost the company's revenue growth.
High order book execution in EPC segment, rising B2C
KEI Industries
1,711
220
239
8.4
sales and higher exports to boost the revenues and
profitability
Speedier execution and speedier sales, strong revenue
Mahindra Lifespace
2,339
456
522
14.5
visibilty in short-to-long run, attractive valuations
Massive capacity expansion along with rail advantage at
Navkar Corporation
3,378
237
265
11.9
ICD as well CFS augurs well for the company
Strong brands and distribution network would boost
Siyaram Silk Mills
1,687
1,800
1,872
4.0
growth going ahead. Stock currently trades at an
inexpensive valuation.
Market leadership in Hindi news genre and no.
2
viewership ranking in English news genre, exit from the
TV Today Network
1,596
268
344
28.6
radio business, and anticipated growth in ad spends by
corporates to benefit the stock.
Source: Company, Angel Research
Market Outlook
May 18, 2017
Key Upcoming Events
Result Calendar
Date
Company
Bajaj Auto, Automotive Axle, Cummins India, Bank of Baroda, Hindustan Media Ventures, Jyothy Laboratories, CESC,
May 18, 2017
Coffee Day Enterprises Ltd
Motherson Sumi, KEC International, HT Media, Electrosteel Castings, Abbott India, MM Forging, Elecon Engineering,
May 19, 2017
GSK Pharma, Tata Power Co., VRL Logistics
Source: Bloomberg, Angel Research
Global economic events release calendar
Bloomberg Data
Date
Time
Country
Event Description
Unit
Period
Last Reported
Estimated
May 18, 2017
7:30 PM Euro Zone
Euro-Zone Consumer Confidence
Value
May A
(3.60)
(3.00)
May 19, 2017
6:00 PM US
Initial Jobless claims
Thousands
May 13
236.00
240.00
May 23, 2017
11:30 AM Germany
GDP nsa (YoY)
% Change
1Q F
2.90
1:00 PM Germany
PMI Manufacturing
Value
May P
58.20
May 24, 2017
7:30 PM US
New home sales
Thousands
Apr
621.00
625.00
1:00 PM Germany
PMI Services
Value
May P
55.40
7:30 PM US
Existing home sales
Million
Apr
5.71
5.67
May 25, 2017
2:00 PM UK
GDP (YoY)
% Change
1Q P
2.10
May 26, 2017
6:00 PM US
GDP Qoq (Annualised)
% Change
1Q S
0.70
0.90
May 30, 2017
7:30 PM US
Consumer Confidence
S.A./ 1985=100 May
120.30
May 31, 2017
1:25 PM Germany
Unemployment change (000's)
Thousands
May
(15.00)
6:30 AM China
PMI Manufacturing
Value
May
51.20
Jun 01, 2017
2:00 PM UK
PMI Manufacturing
Value
May
57.30
Jun 02, 2017
6:00 PM US
Change in Nonfarm payrolls
Thousands
May
211.00
175.00
6:00 PM US
Unnemployment rate
%
May
4.40
Jun 07, 2017
2:30 PM India
RBI Reverse Repo rate
%
Jun 7
6.00
2:30 PM Euro Zone
Euro-Zone GDP s.a. (QoQ)
% Change
1Q F
0.50
2:30 PM India
RBI Repo rate
%
Jun 7
6.25
2:30 PM India
RBI Cash Reserve ratio
%
Jun 7
4.00
Jun 08, 2017
China
Exports YoY%
% Change
May
8.00
5:15 PM Euro Zone
ECB announces interest rates
%
Jun 8
-
Jun 09, 2017
India
Imports YoY%
% Change
May
49.10
Source: Bloomberg, Angel Research
Market Outlook
May 18, 2017
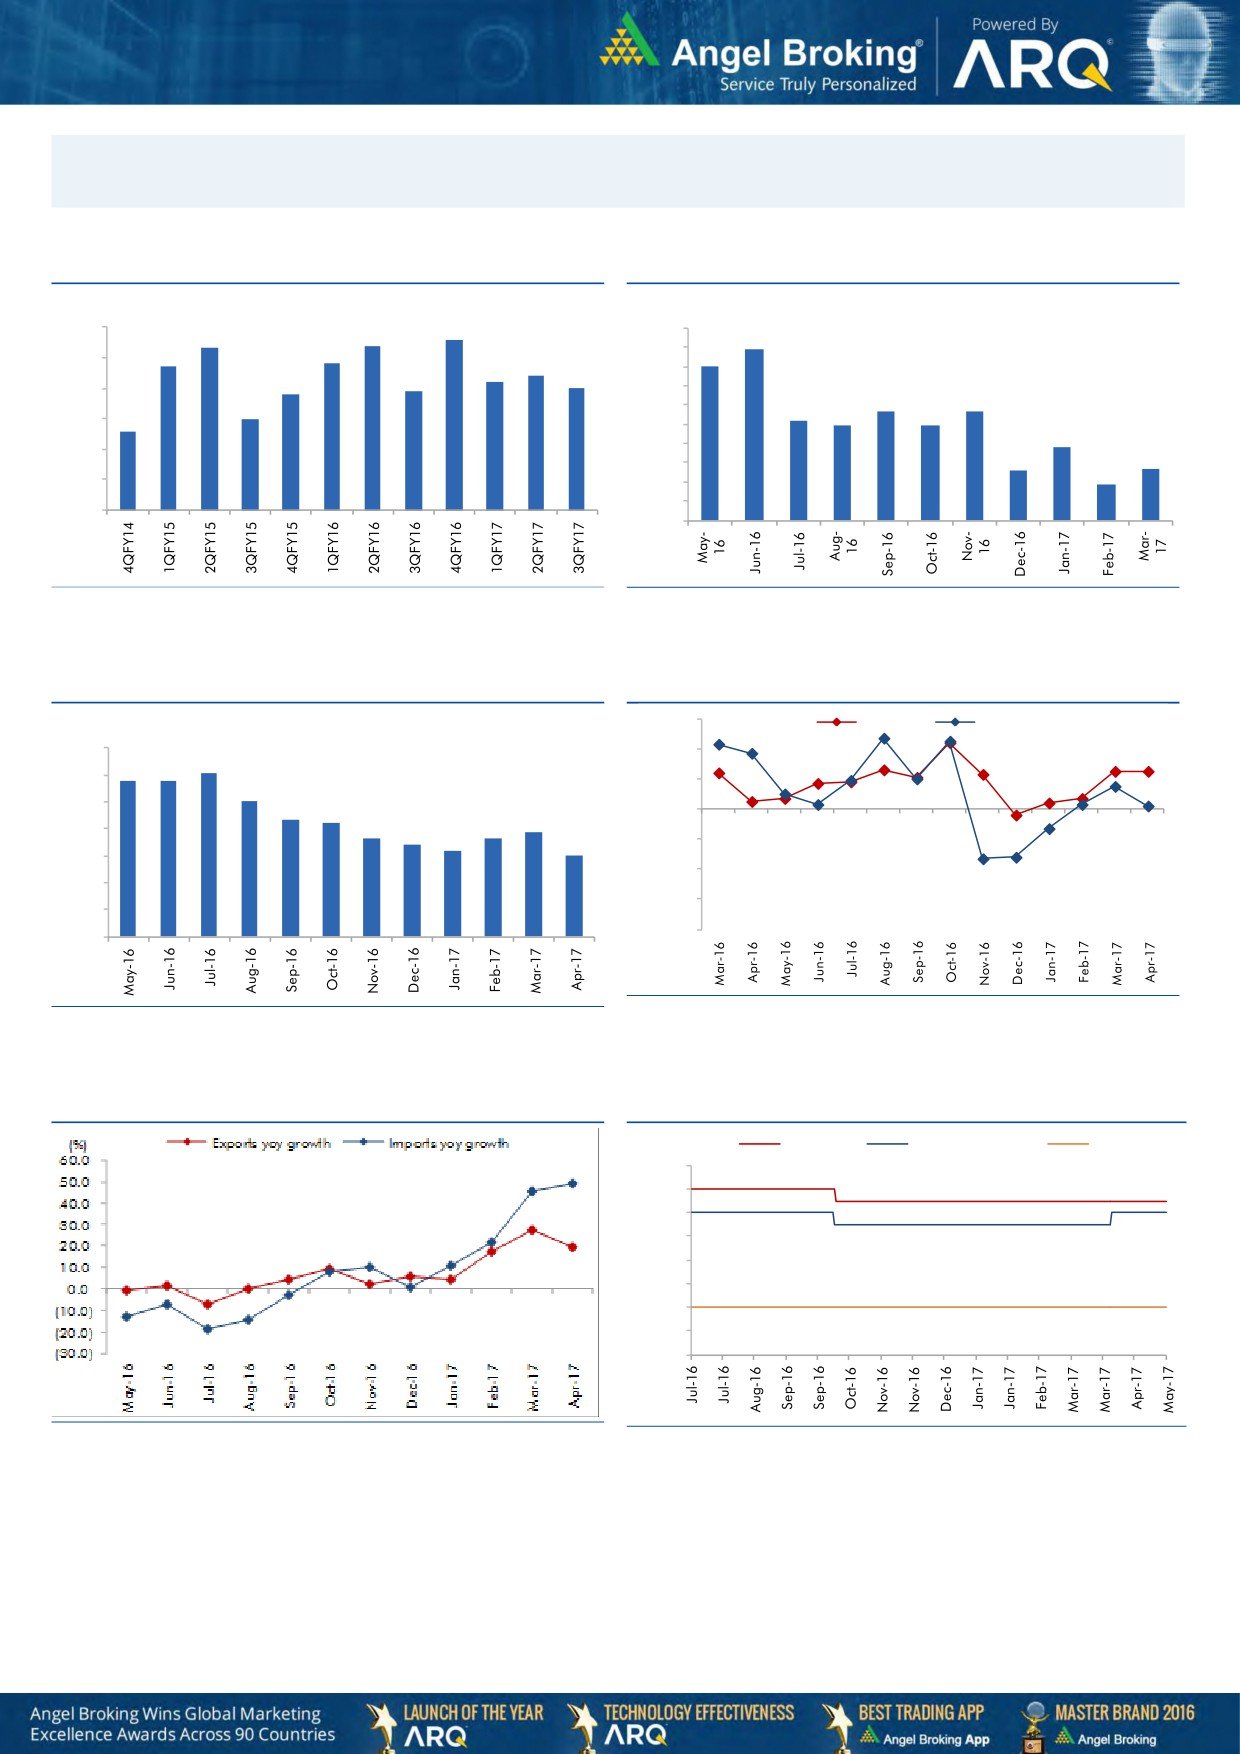
Macro watch
Exhibit 1: Quarterly GDP trends
Exhibit 2: IIP trends
(%)
(%)
8.6
9.0
8.3
8.4
10.0
8.9
7.7
7.8
9.0
8.0
8.0
7.4
7.2
8.0
6.9
7.0
6.8
7.0
7.0
5.7
5.7
6.0
6.0
5.2
4.9
4.9
6.0
5.6
5.0
3.8
4.0
5.0
2.6
2.7
3.0
1.9
4.0
2.0
1.0
3.0
-
Source: CSO, Angel Research
Source: MOSPI, Angel Research
Exhibit 3: Monthly CPI inflation trends
Exhibit 4: Manufacturing and services PMI
56.0
Mfg. PMI
Services PMI
(%)
7.0
54.0
6.1
5.8
5.8
6.0
52.0
5.1
5.0
4.3
4.2
50.0
3.9
3.6
3.7
4.0
3.4
3.2
3.0
48.0
3.0
46.0
2.0
44.0
1.0
42.0
-
Source: Market, Angel Research; Note: Level above 50 indicates expansion
Source: MOSPI, Angel Research
Exhibit 5: Exports and imports growth trends
Exhibit 6: Key policy rates
(%)
Repo rate
Reverse Repo rate
CRR
7.00
6.50
6.00
5.50
5.00
4.50
4.00
3.50
3.00
Source: Bloomberg, Angel Research
Source: RBI, Angel Research
Market Outlook
May 18, 2017
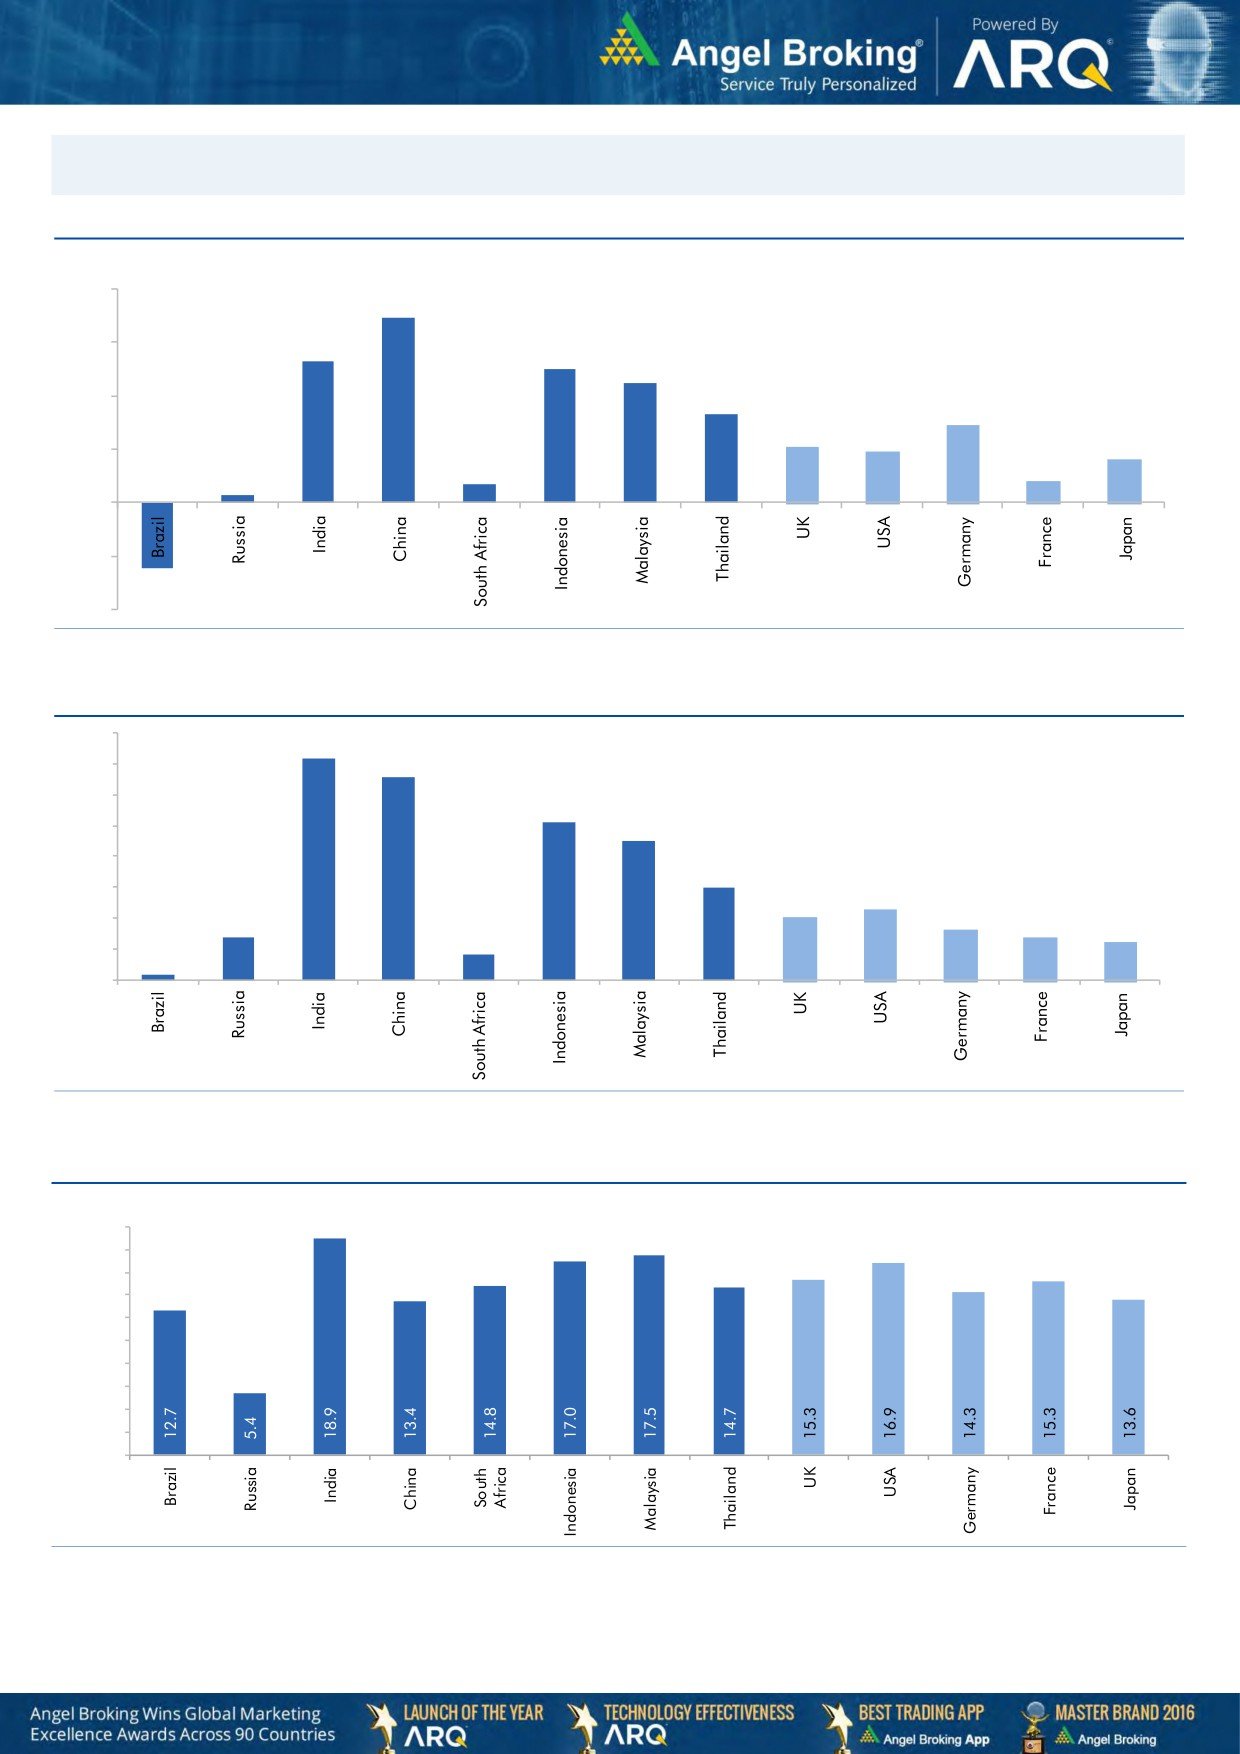
Global watch
Exhibit 1: Latest quarterly GDP Growth (%, yoy) across select developing and developed countries
(%)
8.0
6.9
6.0
5.3
5.0
0.7
4.5
4.0
3.3
2.9
2.1
1.9
2.0
0.3
1.6
0.8
-
(2.0)
(2.5)
(4.0)
Source: Bloomberg, Angel Research
Exhibit 2: 2016 GDP Growth projection by IMF (%, yoy) across select developing and developed countries
(%)
7.2
7.0
6.6
6.0
5.1
5.0
4.5
4.0
3.0
3.0
2.3
2.0
1.4
1.6
2.0
1.4
1.2
0.2
0.8
1.0
-
Source: IMF, Angel Research
Exhibit 3: One year forward P-E ratio across select developing and developed countries
(x)
20.0
18.0
16.0
14.0
12.0
10.0
8.0
6.0
4.0
2.0
-
Source: IMF, Angel Research
Stock Watch
May 18, 2017
Company Name
Reco
CMP
Target
Mkt Cap
Sales ( Čcr )
OPM(%)
EPS (Č)
PER(x)
P/BV(x)
RoE(%)
EV/Sales(x)
(Č)
Price ( Č)
( Č cr )
FY17E FY18E
FY17E
FY18E
FY17E
FY18E
FY17E
FY18E
FY17E
FY18E
FY17E
FY18E
FY17E
FY18E
Agri / Agri Chemical
Rallis
Neutral
246
-
4,781
1,937
2,164
13.3
14.3
9.0
11.0
27.3
22.4
4.8
4.2
18.4
19.8
2.5
2.2
United Phosphorus
Neutral
830
-
42,147
15,176
17,604
18.5
18.5
37.4
44.6
22.2
18.6
4.4
3.6
21.4
21.2
2.9
2.4
Auto & Auto Ancillary
Ashok Leyland
Buy
88
111
24,987
20,021
21,915
11.6
11.9
4.5
5.3
19.5
16.5
4.0
3.5
20.6
21.5
1.2
1.1
Bajaj Auto
Neutral
3,033
-
87,753
25,093
27,891
19.5
19.2
143.9
162.5
21.1
18.7
5.9
5.1
30.3
29.4
3.2
2.8
Bharat Forge
Neutral
1,123
-
26,150
7,726
8,713
20.5
21.2
35.3
42.7
31.8
26.3
5.9
5.3
18.9
20.1
3.4
3.0
Eicher Motors
Neutral
29,094
-
79,164
16,583
20,447
17.5
18.0
598.0
745.2
48.7
39.0
16.6
12.7
41.2
38.3
4.6
3.7
Gabriel India
Neutral
132
-
1,890
1,544
1,715
9.0
9.3
5.4
6.3
24.4
20.9
4.6
4.1
18.9
19.5
1.2
1.0
Hero Motocorp
Neutral
3,643
-
72,745
28,083
30,096
15.3
15.7
171.8
187.0
21.2
19.5
7.4
6.2
30.1
27.9
2.4
2.2
Jamna Auto Industries Neutral
238
-
1,900
1,486
1,620
9.8
9.9
15.0
17.2
15.9
13.9
3.5
2.9
21.8
21.3
1.3
1.2
L G Balakrishnan & Bros Neutral
698
-
1,096
1,302
1,432
11.6
11.9
43.7
53.0
16.0
13.2
2.3
2.1
13.8
14.2
0.9
0.8
Mahindra and Mahindra Neutral
1,378
-
85,571
46,534
53,077
11.6
11.7
67.3
78.1
20.5
17.7
3.3
2.9
15.4
15.8
1.8
1.6
Maruti
Neutral
6,951
-
209,973
67,822
83,288
16.0
16.4
253.8
312.4
27.4
22.3
6.3
5.1
23.0
22.9
2.8
2.2
Minda Industries
Neutral
560
-
4,840
2,728
3,042
9.0
9.1
68.2
86.2
8.2
6.5
1.9
1.5
23.8
24.3
1.8
1.6
Motherson Sumi
Neutral
415
-
58,283
45,896
53,687
7.8
8.3
13.0
16.1
31.8
25.8
10.3
8.2
34.7
35.4
1.3
1.1
Rane Brake Lining
Neutral
1,042
-
825
511
562
11.3
11.5
28.1
30.9
37.1
33.7
5.7
5.1
15.3
15.0
1.8
1.6
Setco Automotive
Neutral
41
-
552
741
837
13.0
13.0
15.2
17.0
2.7
2.4
0.4
0.4
15.8
16.3
1.1
1.0
Tata Motors
Neutral
450
-
129,830
300,209
338,549
8.9
8.4
42.7
54.3
10.5
8.3
1.7
1.4
15.6
17.2
0.5
0.5
TVS Motor
Neutral
533
-
25,310
13,390
15,948
6.9
7.1
12.8
16.5
41.8
32.2
10.4
8.2
26.3
27.2
1.9
1.6
Amara Raja Batteries
Accumulate
938
1,009
16,016
5,305
6,100
16.0
16.3
28.4
34.0
33.0
27.6
6.4
5.3
19.3
19.3
3.0
2.6
Exide Industries
Neutral
243
-
20,676
7,439
8,307
15.0
15.0
8.1
9.3
30.0
26.2
4.2
3.8
14.3
16.7
2.4
2.1
Apollo Tyres
Neutral
237
-
12,082
12,877
14,504
14.3
13.9
21.4
23.0
11.1
10.3
1.7
1.5
16.4
15.2
1.1
1.0
Ceat
Neutral
1,832
-
7,412
7,524
8,624
13.0
12.7
131.1
144.3
14.0
12.7
2.6
2.2
19.8
18.6
1.1
0.9
JK Tyres
Neutral
179
-
4,058
7,455
8,056
15.0
15.0
21.8
24.5
8.2
7.3
1.7
1.4
22.8
21.3
0.7
0.6
Swaraj Engines
Neutral
1,855
-
2,304
660
810
15.2
16.4
54.5
72.8
34.0
25.5
10.6
9.6
31.5
39.2
3.3
2.7
Subros
Neutral
247
-
1,484
1,488
1,681
11.7
11.9
6.4
7.2
38.6
34.5
4.1
3.7
10.8
11.4
1.2
1.1
Indag Rubber
Neutral
220
-
577
286
326
19.8
16.8
11.7
13.3
18.8
16.5
3.2
3.0
17.8
17.1
1.7
1.5
Capital Goods
ACE
Neutral
68
-
668
709
814
4.1
4.6
1.4
2.1
48.2
32.1
2.0
1.9
4.4
6.0
1.1
1.0
BEML
Neutral
1,392
-
5,795
3,451
4,055
6.3
9.2
31.4
57.9
44.3
24.0
2.7
2.4
6.3
10.9
1.8
1.5
Bharat Electronics
Neutral
180
-
40,216
8,137
9,169
16.8
17.2
58.7
62.5
3.1
2.9
0.5
0.4
44.6
46.3
3.9
3.5
Stock Watch
May 18, 2017
Company Name
Reco
CMP
Target
Mkt Cap
Sales ( Čcr )
OPM(%)
EPS (Č)
PER(x)
P/BV(x)
RoE(%)
EV/Sales(x)
(Č)
Price ( Č)
( Č cr )
FY17E
FY18E
FY17E
FY18E
FY17E
FY18E
FY17E
FY18E
FY17E
FY18E
FY17E
FY18E
FY17E
FY18E
Capital Goods
Voltas
Neutral
430
-
14,238
6,511
7,514
7.9
8.7
12.9
16.3
33.4
26.4
6.0
5.3
16.7
18.5
1.9
1.7
BGR Energy
Neutral
174
-
1,257
16,567
33,848
6.0
5.6
7.8
5.9
22.3
29.5
1.3
1.2
4.7
4.2
0.2
0.1
BHEL
Neutral
171
-
41,829
28,797
34,742
-
2.8
2.3
6.9
74.3
24.8
1.3
1.2
1.3
4.8
1.1
0.8
Blue Star
Accumulate
672
760
6,422
4,283
5,077
5.9
7.3
14.9
22.1
45.1
30.4
8.8
7.4
20.4
26.4
1.5
1.3
CG Power and Industrial
Neutral
94
-
5,869
5,777
6,120
5.9
7.0
3.3
4.5
28.4
20.8
1.3
1.2
4.4
5.9
1.0
0.8
Solutions
Greaves Cotton
Neutral
159
-
3,871
1,755
1,881
16.8
16.9
7.8
8.5
20.3
18.7
4.1
3.8
20.6
20.9
1.9
1.7
Inox Wind
Neutral
158
-
3,497
5,605
6,267
15.7
16.4
24.8
30.0
6.4
5.3
1.8
1.3
25.9
24.4
0.7
0.5
KEC International
Neutral
245
-
6,310
9,294
10,186
7.9
8.1
9.9
11.9
24.8
20.6
3.6
3.2
15.6
16.3
0.9
0.8
KEI Industries
Accumulate
220
239
1,711
2,682
3,058
10.4
10.0
11.7
12.8
18.7
17.2
3.8
3.1
20.1
18.2
0.8
0.7
Thermax
Neutral
1,015
-
12,088
5,421
5,940
7.3
7.3
25.7
30.2
39.5
33.6
4.8
4.4
12.2
13.1
2.1
1.9
VATech Wabag
Neutral
680
-
3,710
3,136
3,845
8.9
9.1
26.0
35.9
26.1
18.9
3.3
2.8
13.4
15.9
1.1
0.9
Cement
ACC
Neutral
1,699
-
31,896
11,225
13,172
13.2
16.9
44.5
75.5
38.2
22.5
3.6
3.3
11.2
14.2
2.8
2.4
Ambuja Cements
Neutral
258
-
51,210
9,350
10,979
18.2
22.5
5.8
9.5
44.5
27.2
3.7
3.4
10.2
12.5
5.5
4.7
India Cements
Neutral
217
-
6,680
4,364
4,997
18.5
19.2
7.9
11.3
27.5
19.2
2.0
1.9
8.0
8.5
2.3
2.0
JK Cement
Neutral
1,115
-
7,794
4,398
5,173
15.5
17.5
31.2
55.5
35.7
20.1
4.3
3.7
12.0
15.5
2.3
1.9
J K Lakshmi Cement
Neutral
515
-
6,061
2,913
3,412
14.5
19.5
7.5
22.5
68.7
22.9
4.2
3.6
12.5
18.0
2.7
2.2
Orient Cement
Neutral
160
-
3,285
2,114
2,558
18.5
20.5
8.1
11.3
19.8
14.2
2.9
2.5
9.0
14.0
2.2
1.7
UltraTech Cement
Neutral
4,476
-
122,873
25,768
30,385
21.0
23.5
111.0
160.0
40.3
28.0
5.1
4.5
13.5
15.8
4.9
4.1
Construction
ITNL
Neutral
113
-
3,721
8,946
10,017
31.0
31.6
8.1
9.1
14.0
12.4
0.5
0.5
4.2
5.0
3.7
3.5
KNR Constructions
Neutral
212
-
2,979
1,385
1,673
14.7
14.0
41.2
48.5
5.1
4.4
1.0
0.8
14.9
15.2
2.2
1.8
Larsen & Toubro
Neutral
1,755
-
163,831
111,017
124,908
11.0
11.0
61.1
66.7
28.7
26.3
3.5
3.2
13.1
12.9
2.5
2.3
Gujarat Pipavav Port
Neutral
160
-
7,716
705
788
52.2
51.7
5.0
5.6
31.9
28.5
3.2
2.8
11.2
11.2
10.6
9.0
Nagarjuna Const.
Neutral
101
-
5,626
8,842
9,775
9.1
8.8
5.3
6.4
19.1
15.8
1.5
1.4
8.2
9.1
0.8
0.7
PNC Infratech
Neutral
150
-
3,844
2,350
2,904
13.1
13.2
9.0
8.8
16.7
17.0
0.6
0.5
15.9
13.9
1.8
1.4
Simplex Infra
Neutral
423
-
2,092
6,829
7,954
10.5
10.5
31.4
37.4
13.5
11.3
1.4
1.3
9.9
13.4
0.7
0.6
Power Mech Projects
Neutral
583
-
857
1,801
2,219
12.7
14.6
72.1
113.9
8.1
5.1
1.5
1.3
16.8
11.9
0.5
0.4
Sadbhav Engineering
Neutral
337
-
5,777
3,598
4,140
10.3
10.6
9.0
11.9
37.4
28.3
3.9
3.4
9.9
11.9
1.9
1.6
NBCC
Neutral
200
-
18,032
7,428
9,549
7.9
8.6
8.2
11.0
24.4
18.2
1.2
1.0
28.2
28.7
2.1
1.6
MEP Infra
Neutral
67
-
1,086
1,877
1,943
30.6
29.8
3.0
4.2
22.3
15.9
10.8
7.3
0.6
0.6
2.0
1.8
Stock Watch
May 18, 2017
Company Name
Reco
CMP
Target
Mkt Cap
Sales ( Čcr )
OPM(%)
EPS (Č)
PER(x)
P/BV(x)
RoE(%)
EV/Sales(x)
(Č)
Price ( Č)
( Č cr )
FY17E
FY18E
FY17E
FY18E
FY17E
FY18E
FY17E
FY18E
FY17E
FY18E
FY17E
FY18E
FY17E
FY18E
Construction
SIPL
Neutral
112
-
3,940
1,036
1,252
65.5
66.2
(8.4)
(5.6)
4.2
4.8
(22.8)
(15.9)
12.0
10.0
Engineers India
Neutral
174
-
11,709
1,725
1,935
16.0
19.1
11.4
13.9
15.2
12.5
2.1
2.0
13.4
15.3
5.7
5.1
Financials
Axis Bank
Buy
503
580
120,464
46,932
53,575
3.5
3.4
32.4
44.6
15.5
11.3
2.0
1.7
13.6
16.5
-
-
Bank of Baroda
Neutral
192
-
44,286
19,980
23,178
1.8
1.8
11.5
17.3
16.7
11.1
1.9
1.6
8.3
10.1
-
-
Canara Bank
Neutral
374
-
22,315
15,225
16,836
1.8
1.8
14.5
28.0
25.8
13.3
1.8
1.4
5.8
8.5
-
-
Can Fin Homes
Neutral
2,759
-
7,344
420
526
3.5
3.5
86.5
107.8
31.9
25.6
6.9
5.6
23.6
24.1
-
-
Cholamandalam Inv. &
Buy
1,044
1,230
16,321
2,012
2,317
6.3
6.3
42.7
53.6
24.5
19.5
3.9
3.3
16.9
18.3
-
-
Fin. Co.
Dewan Housing Finance Buy
429
520
13,434
2,225
2,688
2.9
2.9
29.7
34.6
14.4
12.4
2.3
1.5
16.1
14.8
-
-
Equitas Holdings
Buy
166
235
5,606
939
1,281
11.7
11.5
5.8
8.2
28.6
20.2
2.5
2.2
10.9
11.5
-
-
Federal Bank
Accumulate
115
125
19,812
8,259
8,995
3.0
3.0
4.3
5.6
26.7
20.5
2.3
2.1
8.5
10.1
-
-
HDFC
Neutral
1,553
-
246,664
11,475
13,450
3.4
3.4
45.3
52.5
34.3
29.6
6.6
5.8
20.2
20.5
-
-
HDFC Bank
Accumulate
1,559
1,650
399,767
46,097
55,433
4.5
4.5
58.4
68.0
26.7
22.9
4.7
3.9
18.8
18.6
-
-
ICICI Bank
Neutral
310
-
180,480
42,800
44,686
3.1
3.3
18.0
21.9
17.2
14.2
2.3
2.2
11.1
12.3
-
-
Karur Vysya Bank
Buy
117
140
7,067
5,640
6,030
3.3
3.2
8.9
10.0
13.1
11.7
1.4
1.3
11.2
11.4
-
-
Lakshmi Vilas Bank
Neutral
189
-
3,624
3,339
3,799
2.7
2.8
11.0
14.0
17.2
13.5
1.8
1.6
11.2
12.7
-
-
LIC Housing Finance
Neutral
690
-
34,839
3,712
4,293
2.6
2.5
39.0
46.0
17.7
15.0
3.3
2.8
19.9
20.1
-
-
Punjab Natl.Bank
Neutral
165
-
35,122
23,532
23,595
2.3
2.4
6.8
12.6
24.3
13.1
3.8
2.7
3.3
6.5
-
-
RBL Bank
Neutral
564
-
21,171
1,783
2,309
2.6
2.6
12.7
16.4
44.4
34.4
4.8
4.3
12.8
13.3
-
-
Repco Home Finance
Accumulate
766
825
4,792
388
457
4.5
4.2
30.0
38.0
25.5
20.2
4.3
3.6
18.0
19.2
-
-
South Ind.Bank
Neutral
26
-
4,723
6,435
7,578
2.5
2.5
2.7
3.1
9.7
8.5
1.3
1.1
10.1
11.2
-
-
St Bk of India
Neutral
308
-
249,500
88,650
98,335
2.6
2.6
13.5
18.8
22.8
16.4
2.2
1.9
7.0
8.5
-
-
Union Bank
Neutral
179
-
12,336
13,450
14,925
2.3
2.3
25.5
34.5
7.0
5.2
1.0
0.9
7.5
10.2
-
-
Yes Bank
Neutral
1,455
-
66,425
8,978
11,281
3.3
3.4
74.0
90.0
19.7
16.2
3.7
3.2
17.0
17.2
-
-
FMCG
Akzo Nobel India
Neutral
1,952
-
9,363
2,955
3,309
13.3
13.7
57.2
69.3
34.2
28.2
11.2
9.4
32.7
33.3
3.0
2.6
Asian Paints
Neutral
1,154
-
110,677
17,128
18,978
16.8
16.4
19.1
20.7
60.4
55.7
21.0
19.8
34.8
35.5
6.4
5.8
Britannia
Neutral
3,667
-
43,999
9,594
11,011
14.6
14.9
80.3
94.0
45.7
39.0
18.8
14.5
41.2
-
4.4
3.8
Colgate
Neutral
977
-
26,581
4,605
5,149
23.4
23.4
23.8
26.9
41.1
36.3
22.7
17.8
64.8
66.8
5.7
5.1
Dabur India
Accumulate
276
304
48,644
8,315
9,405
19.8
20.7
8.1
9.2
34.1
30.0
9.5
7.9
31.6
31.0
5.5
4.8
GlaxoSmith Con*
Neutral
5,310
-
22,331
4,350
4,823
21.2
21.4
179.2
196.5
29.6
27.0
7.9
6.7
27.1
26.8
4.5
4.0
Stock Watch
May 18, 2017
Company Name
Reco
CMP
Target
Mkt Cap
Sales ( Čcr )
OPM(%)
EPS (Č)
PER(x)
P/BV(x)
RoE(%)
EV/Sales(x)
(Č)
Price ( Č)
( Č cr )
FY17E FY18E
FY17E
FY18E
FY17E
FY18E
FY17E
FY18E
FY17E
FY18E
FY17E
FY18E
FY17E
FY18E
FMCG
Godrej Consumer
Neutral
1,858
-
63,282
10,235
11,428
18.4
18.6
41.1
44.2
45.2
42.0
10.0
8.5
24.9
24.8
6.3
5.5
HUL
Neutral
1,006
-
217,809
35,252
38,495
17.8
17.8
20.7
22.4
48.7
45.0
46.6
40.0
95.6
88.9
6.0
5.5
ITC
Neutral
282
-
342,374
40,059
44,439
38.3
39.2
9.0
10.1
31.4
27.8
8.8
7.7
27.8
27.5
8.1
7.2
Marico
Neutral
309
-
39,811
6,430
7,349
18.8
19.5
6.4
7.7
48.2
40.1
14.6
12.2
33.2
32.5
6.0
5.2
Nestle*
Neutral
6,555
-
63,197
10,073
11,807
20.7
21.5
124.8
154.2
52.5
42.5
21.6
19.4
34.8
36.7
6.1
5.2
Tata Global
Neutral
153
-
9,647
8,675
9,088
9.8
9.8
7.4
8.2
20.7
18.6
1.6
1.6
7.9
8.1
1.0
1.0
Procter & Gamble
Neutral
7,669
-
24,895
2,939
3,342
23.2
23.0
146.2
163.7
52.5
46.9
13.3
11.0
25.3
23.5
8.0
7.0
Hygiene
IT
HCL Tech^
Buy
854
1,014
121,893
46,723
52,342
22.1
20.9
60.0
62.8
14.2
13.6
3.6
3.1
25.3
22.4
2.3
2.0
Infosys
Buy
952
1,179
218,715
68,484
73,963
26.0
26.0
63.0
64.0
15.1
14.9
3.2
2.9
20.8
19.7
2.9
2.5
TCS
Accumulate
2,451
2,651
483,021
117,966
127,403
27.5
27.6
134.3
144.5
18.3
17.0
5.4
5.0
29.8
29.7
3.7
3.5
Tech Mahindra
Buy
432
600
42,066
29,673
32,937
15.5
17.0
32.8
39.9
13.2
10.8
2.6
2.2
19.6
20.7
1.2
1.0
Wipro
Accumulate
506
570
123,093
55,421
58,536
20.3
20.3
35.1
36.5
14.4
13.9
2.5
2.1
19.2
14.6
1.6
1.4
Media
D B Corp
Neutral
367
-
6,747
2,297
2,590
27.4
28.2
21.0
23.4
17.5
15.7
4.1
3.5
23.7
23.1
2.7
2.4
HT Media
Neutral
90
-
2,087
2,693
2,991
12.6
12.9
7.9
9.0
11.4
10.0
1.0
0.9
7.8
8.3
0.4
0.2
Jagran Prakashan
Buy
190
225
6,211
2,355
2,635
28.0
28.0
10.8
12.5
17.6
15.2
3.8
3.3
21.7
21.7
2.7
2.3
Sun TV Network
Neutral
889
-
35,046
2,850
3,265
70.1
71.0
26.2
30.4
33.9
29.3
8.7
7.7
24.3
25.6
11.9
10.2
Hindustan Media
Neutral
285
-
2,091
1,016
1,138
24.3
25.2
27.3
30.1
10.4
9.5
2.0
1.8
16.2
15.8
1.4
1.2
Ventures
TV Today Network
Buy
268
344
1,596
567
645
26.7
27.0
15.4
18.1
17.4
14.8
2.6
2.3
14.9
15.2
2.4
2.0
Metals & Mining
Coal India
Neutral
277
-
171,635
84,638
94,297
21.4
22.3
24.5
27.1
11.3
10.2
4.7
4.5
42.6
46.0
1.5
1.4
Hind. Zinc
Neutral
252
-
106,563
14,252
18,465
55.9
48.3
15.8
21.5
16.0
11.7
2.6
2.3
17.0
20.7
7.5
5.8
Hindalco
Neutral
198
-
44,496
107,899
112,095
7.4
8.2
9.2
13.0
21.6
15.3
1.0
1.0
4.8
6.6
0.9
0.9
JSW Steel
Neutral
207
-
49,952
53,201
58,779
16.1
16.2
130.6
153.7
1.6
1.3
0.2
0.2
14.0
14.4
1.7
1.5
NMDC
Neutral
128
-
40,482
6,643
7,284
44.4
47.7
7.1
7.7
18.0
16.6
1.6
1.5
8.8
9.2
3.9
3.5
SAIL
Neutral
63
-
25,875
47,528
53,738
(0.7)
2.1
(1.9)
2.6
24.1
0.7
0.7
(1.6)
3.9
1.4
1.3
Vedanta
Neutral
242
-
90,086
71,744
81,944
19.2
21.7
13.4
20.1
18.1
12.1
1.6
1.4
8.4
11.3
1.6
1.3
Tata Steel
Neutral
493
-
47,915
121,374
121,856
7.2
8.4
18.6
34.3
26.5
14.4
1.7
1.5
6.1
10.1
1.0
1.0
Oil & Gas
GAIL
Neutral
408
-
69,073
56,220
65,198
9.3
10.1
27.1
33.3
15.1
12.3
1.4
1.3
9.3
10.7
1.4
1.2
ONGC
Neutral
184
-
236,260
137,222
152,563
15.0
21.8
19.5
24.1
9.4
7.6
0.8
0.8
8.5
10.1
2.0
1.8
Indian Oil Corp
Neutral
444
-
215,724
373,359
428,656
5.9
5.5
54.0
59.3
8.2
7.5
1.3
1.2
16.0
15.6
0.7
0.6
Stock Watch
May 18, 2017
Company Name
Reco
CMP
Target
Mkt Cap
Sales ( Čcr )
OPM(%)
EPS (Č)
PER(x)
P/BV(x)
RoE(%)
EV/Sales(x)
(Č)
Price ( Č)
( Č cr )
FY17E FY18E
FY17E
FY18E
FY17E
FY18E
FY17E
FY18E
FY17E
FY18E
FY17E
FY18E
FY17E
FY18E
Oil & Gas
Reliance Industries
Neutral
1,352
-
439,724
301,963
358,039
12.1
12.6
87.7
101.7
15.4
13.3
1.6
1.4
10.7
11.3
1.9
1.6
Pharmaceuticals
Alembic Pharma
Accumulate
609
648
11,472
3,101
3,966
19.7
20.5
21.4
25.5
28.4
23.9
6.0
4.9
23.0
22.8
3.7
2.7
Alkem Laboratories Ltd
Buy
1,903
2,257
22,754
6,065
7,009
18.7
20.0
80.2
92.0
23.7
20.7
5.3
4.5
22.5
21.6
3.7
3.2
Aurobindo Pharma
Buy
608
877
35,616
15,720
18,078
23.7
23.7
41.4
47.3
14.7
12.9
3.8
3.0
29.6
26.1
2.5
2.2
Aventis*
Neutral
4,171
-
9,605
2,206
2,508
16.6
16.8
128.9
139.9
32.4
29.8
5.5
4.3
21.6
23.5
4.1
3.4
Cadila Healthcare
Neutral
478
-
48,945
10,429
12,318
17.7
21.6
13.1
19.2
36.5
24.9
7.6
6.1
22.8
27.1
4.7
3.9
Cipla
Sell
559
465
44,982
15,378
18,089
15.7
16.8
19.3
24.5
29.0
22.8
3.4
3.0
12.3
13.9
3.1
2.6
Dr Reddy's
Neutral
2,732
-
45,262
14,081
15,937
16.1
18.6
72.6
105.9
37.6
25.8
3.7
3.3
9.6
13.6
3.4
3.0
Dishman Pharma
Sell
305
143
4,918
1,718
1,890
22.7
22.8
9.5
11.3
32.1
27.0
3.1
2.8
10.1
10.9
3.3
2.9
GSK Pharma*
Neutral
2,424
-
20,534
2,800
3,290
10.2
20.6
32.2
60.3
75.3
40.2
13.9
13.8
17.2
34.5
7.1
6.1
Indoco Remedies
Accumulate
216
240
1,991
1,112
1,289
16.2
18.2
11.6
16.0
18.6
13.5
3.0
2.5
17.0
20.1
1.9
1.6
Ipca labs
Accumulate
544
613
6,869
3,258
3,747
12.8
15.3
12.1
19.2
45.0
28.4
2.8
2.6
6.4
9.5
2.2
1.9
Lupin
Buy
1,297
1,809
58,584
15,912
18,644
26.4
26.7
58.1
69.3
22.3
18.7
4.3
3.6
21.4
20.9
3.8
3.1
Natco Pharma
Neutral
956
-
16,661
2,090
2,335
32.1
26.6
26.8
23.2
35.6
41.2
10.1
8.7
28.4
21.1
8.0
98.7
Sun Pharma
Buy
651
847
156,094
31,129
35,258
32.0
32.9
30.2
35.3
21.5
18.4
3.5
2.9
20.0
20.1
4.6
3.9
Power
Tata Power
Neutral
85
-
23,085
36,916
39,557
17.4
27.1
5.1
6.3
16.7
13.6
1.5
1.4
9.0
10.3
1.6
1.5
NTPC
Neutral
159
-
131,350
86,605
95,545
17.5
20.8
11.8
13.4
13.5
11.9
1.4
1.3
10.5
11.1
2.9
2.9
Power Grid
Accumulate
208
223
108,948
25,315
29,193
88.2
88.7
14.2
17.2
14.7
12.1
2.2
2.0
15.2
16.1
9.0
8.0
Real Estate
Prestige Estate
Neutral
238
-
8,919
4,707
5,105
25.2
26.0
10.3
13.0
23.1
18.3
1.9
1.7
10.3
10.2
3.1
2.7
MLIFE
Accumulate
456
522
2,339
1,152
1,300
22.7
24.6
29.9
35.8
15.2
12.7
1.1
1.1
7.6
8.6
2.7
2.3
Telecom
Bharti Airtel
Neutral
376
-
150,302
105,086
114,808
34.5
34.7
12.2
16.4
30.8
22.9
2.1
1.9
6.8
8.4
2.3
2.0
Idea Cellular
Neutral
87
-
31,407
40,133
43,731
37.2
37.1
6.4
6.5
13.6
13.4
1.1
1.1
8.2
7.6
1.8
1.5
zOthers
Abbott India
Neutral
4,221
-
8,968
3,153
3,583
14.1
14.4
152.2
182.7
27.7
23.1
136.2
116.3
25.6
26.1
2.6
2.2
Asian Granito
Neutral
386
-
1,162
1,060
1,169
12.2
12.5
12.7
15.9
30.5
24.3
2.9
2.6
9.5
10.7
1.4
1.2
Bajaj Electricals
Accumulate
350
395
3,543
4,801
5,351
5.7
6.2
10.4
13.7
33.6
25.6
4.2
3.7
12.4
14.5
0.7
0.7
Banco Products (India)
Neutral
239
-
1,711
1,353
1,471
12.3
12.4
14.5
16.3
16.5
14.7
22.8
20.5
14.5
14.6
1.2
129.7
Coffee Day Enterprises
Neutral
268
-
5,522
2,964
3,260
20.5
21.2
4.7
8.0
-
33.5
3.1
2.8
5.5
8.5
2.3
2.0
Ltd
Competent Automobiles Neutral
230
-
147
1,137
1,256
3.1
2.7
28.0
23.6
8.2
9.7
44.2
40.0
14.3
11.5
0.1
0.1
Elecon Engineering
Neutral
61
-
689
1,482
1,660
13.7
14.5
3.9
5.8
15.8
10.6
3.7
3.4
7.8
10.9
0.8
0.7
Stock Watch
May 18, 2017
Company Name
Reco
CMP
Target
Mkt Cap
Sales ( Čcr )
OPM(%)
EPS (Č)
PER(x)
P/BV(x)
RoE(%)
EV/Sales(x)
(Č)
Price ( Č)
( Č cr )
FY17E
FY18E
FY17E
FY18E
FY17E
FY18E
FY17E
FY18E
FY17E
FY18E
FY17E
FY18E
FY17E
FY18E
zOthers
Finolex Cables
Neutral
539
-
8,247
2,883
3,115
12.0
12.1
14.2
18.6
38.0
29.0
20.2
17.7
15.8
14.6
2.6
2.3
Garware Wall Ropes
Neutral
805
-
1,762
863
928
15.1
15.2
36.4
39.4
22.1
20.4
4.0
3.4
17.5
15.9
2.0
1.8
Goodyear India*
Neutral
882
-
2,034
1,598
1,704
10.4
10.2
49.4
52.6
17.9
16.8
82.4
72.3
18.2
17.0
1.0
136.6
Hitachi
Neutral
1,859
-
5,054
2,081
2,433
8.8
8.9
33.4
39.9
55.7
46.6
44.9
37.4
22.1
21.4
2.4
2.0
HSIL
Neutral
343
-
2,480
2,384
2,515
15.8
16.3
15.3
19.4
22.4
17.7
22.3
19.2
7.8
9.3
1.2
1.1
Interglobe Aviation
Neutral
1,113
-
40,221
21,122
26,005
14.5
27.6
110.7
132.1
10.1
8.4
60.2
43.0
168.5
201.1
1.9
1.5
Jyothy Laboratories
Neutral
381
-
6,929
1,440
2,052
11.5
13.0
8.5
10.0
44.9
38.1
10.9
10.1
18.6
19.3
5.1
3.6
Kirloskar Engines India
Neutral
392
-
5,662
2,554
2,800
9.9
10.0
10.5
12.1
37.3
32.4
15.6
14.7
10.7
11.7
1.9
1.7
Ltd
Linc Pen & Plastics
Neutral
279
-
412
382
420
9.3
9.5
13.5
15.7
20.7
17.8
3.5
3.1
17.1
17.3
1.1
1.0
M M Forgings
Neutral
641
-
774
546
608
20.4
20.7
41.3
48.7
15.5
13.2
87.8
77.7
16.6
17.0
1.3
1.1
Manpasand Bever.
Neutral
785
-
4,492
836
1,087
19.6
19.4
16.9
23.8
46.5
33.0
5.6
4.9
12.0
14.8
5.1
3.8
Mirza International
Neutral
145
-
1,738
963
1,069
17.2
18.0
6.1
7.5
23.6
19.2
3.6
3.1
15.0
15.7
2.0
1.8
MT Educare
Neutral
72
-
287
366
417
17.7
18.2
9.4
10.8
7.7
6.7
1.7
1.5
22.2
22.3
0.7
0.6
Narayana Hrudaya
Neutral
300
-
6,124
1,873
2,166
11.5
11.7
2.6
4.0
113.3
75.6
7.0
6.3
6.1
8.3
3.4
2.9
Navkar Corporation
Accumulate
237
265
3,378
369
561
42.9
42.3
6.9
11.5
34.3
20.6
2.4
2.2
7.4
10.5
10.2
6.7
Navneet Education
Neutral
166
-
3,877
1,062
1,147
24.0
24.0
6.1
6.6
27.3
25.1
5.6
5.0
20.6
19.8
3.7
3.5
Nilkamal
Neutral
2,062
-
3,076
1,995
2,165
10.7
10.4
69.8
80.6
29.5
25.6
117.8
102.3
16.6
16.5
1.5
1.4
Page Industries
Neutral
15,012
-
16,744
2,450
3,124
20.1
17.6
299.0
310.0
50.2
48.4
334.3
255.2
47.1
87.5
6.9
5.4
Parag Milk Foods
Neutral
249
-
2,097
1,919
2,231
9.3
9.6
9.5
12.9
26.4
19.3
4.1
3.4
15.5
17.5
1.2
1.1
Quick Heal
Neutral
232
-
1,628
408
495
27.3
27.0
7.7
8.8
30.0
26.4
2.8
2.8
9.3
10.6
3.1
2.6
Radico Khaitan
Accumulate
129
147
1,714
1,667
1,824
13.0
13.2
6.7
8.2
19.4
15.7
1.8
1.6
9.0
10.2
1.4
1.3
Relaxo Footwears
Neutral
464
-
5,568
2,085
2,469
9.2
8.2
7.6
8.0
61.3
58.3
23.8
20.3
17.9
18.8
2.8
2.4
S H Kelkar & Co.
Neutral
286
-
4,136
1,036
1,160
15.1
15.0
6.1
7.2
46.8
39.8
5.0
4.6
10.7
11.5
3.9
3.4
Siyaram Silk Mills
Neutral
1,800
-
1,687
1,652
1,857
11.6
11.7
92.4
110.1
19.5
16.3
2.9
2.5
14.7
15.2
1.2
1.1
Styrolution ABS India*
Neutral
769
-
1,352
1,440
1,537
9.2
9.0
40.6
42.6
18.9
18.1
48.4
44.0
12.3
11.6
0.9
0.8
Surya Roshni
Neutral
287
-
1,256
3,342
3,625
7.8
7.5
17.3
19.8
16.6
14.5
31.5
25.3
10.5
10.8
0.6
0.6
Team Lease Serv.
Neutral
1,167
-
1,995
3,229
4,001
1.5
1.8
22.8
32.8
51.3
35.5
5.5
4.8
10.7
13.4
0.5
0.4
The Byke Hospitality
Neutral
200
-
803
287
384
20.5
20.5
7.6
10.7
26.4
18.7
5.5
4.5
20.7
23.5
2.8
2.1
Transport Corporation of
Neutral
262
-
2,006
2,671
2,911
8.5
8.8
13.9
15.7
18.9
16.7
2.6
2.3
13.7
13.8
0.9
0.8
India
Stock Watch
May 18, 2017
Company Name
Reco
CMP
Target Mkt Cap
Sales ( Čcr )
OPM(%)
EPS (Č)
PER(x)
P/BV(x)
RoE(%)
EV/Sales(x)
(Č)
Price ( Č)
( Č cr )
FY17E FY18E FY17E FY18E FY17E FY18E FY17E FY18E FY17E FY18E FY17E FY18E FY17E FY18E
zOthers
TVS Srichakra
Neutral
4,079
-
3,123
2,304
2,614
13.7
13.8
231.1
266.6
17.7
15.3
458.3
360.8
33.9
29.3
1.4
1.2
UFO Moviez
Neutral
440
-
1,214
619
685
33.2
33.4
30.0
34.9
14.7
12.6
2.0
1.8
13.8
13.9
1.7
1.3
Visaka Industries
Neutral
371
-
589
1,051
1,138
10.3
10.4
21.0
23.1
17.7
16.0
47.6
44.6
9.0
9.2
0.8
0.8
VRL Logistics
Neutral
338
-
3,082
1,902
2,119
16.7
16.6
14.6
16.8
23.2
20.1
5.1
4.5
21.9
22.2
1.7
1.5
VIP Industries
Accumulate
200
218
2,821
1,270
1,450
10.4
10.4
5.6
6.5
35.7
30.7
7.4
6.4
20.7
21.1
2.2
1.9
Navin Fluorine
Buy
2,993
3,650
2,930
789
945
21.1
22.4
120.1
143.4
24.9
20.9
4.0
3.5
17.8
18.5
3.6
3.0
Source: Company, Angel Research; Note: *December year end; #September year end; &October year end; Price as on May 17, 2017
Market Outlook
May 18, 2017
Research Team Tel: 022 - 39357800
DISCLAIMER
Angel Broking Private Limited (hereinafter referred to as “Angel”) is a registered Member of National Stock Exchange of India
Limited,Bombay Stock Exchange Limited and Metropolitan Stock Exchange Limited. It is also registered as a Depository Participant with
CDSL and Portfolio Manager with SEBI. It also has registration with AMFI as a Mutual Fund Distributor. Angel Broking Private Limited is a
registered entity with SEBI for Research Analyst in terms of SEBI (Research Analyst) Regulations, 2014 vide registration number
INH000000164. Angel or its associates has not been debarred/ suspended by SEBI or any other regulatory authority for accessing
/dealing in securities Market. Angel or its associates/analyst has not received any compensation / managed or
co-managed public offering of securities of the company covered by Analyst during the past twelve months.
This document is solely for the personal information of the recipient, and must not be singularly used as the basis of any investment
decision. Nothing in this document should be construed as investment or financial advice. Each recipient of this document should make
such investigations as they deem necessary to arrive at an independent evaluation of an investment in the securities of the companies
referred to in this document (including the merits and risks involved), and should consult their own advisors to determine the merits and
risks of such an investment.
Reports based on technical and derivative analysis center on studying charts of a stock's price movement, outstanding positions and
trading volume, as opposed to focusing on a company's fundamentals and, as such, may not match with a report on a company's
fundamentals. Investors are advised to refer the Fundamental and Technical Research Reports available on our website to evaluate the
contrary view, if any.
The information in this document has been printed on the basis of publicly available information, internal data and other reliable
sources believed to be true, but we do not represent that it is accurate or complete and it should not be relied on as such, as this
document is for general guidance only. Angel Broking Pvt. Limited or any of its affiliates/ group companies shall not be in any way
responsible for any loss or damage that may arise to any person from any inadvertent error in the information contained in this report.
Angel Broking Pvt. Limited has not independently verified all the information contained within this document. Accordingly, we cannot
testify, nor make any representation or warranty, express or implied, to the accuracy, contents or data contained within this document.
While Angel Broking Pvt. Limited endeavors to update on a reasonable basis the information discussed in this material, there may be
regulatory, compliance, or other reasons that prevent us from doing so.
This document is being supplied to you solely for your information, and its contents, information or data may not be reproduced,
redistributed or passed on, directly or indirectly.
Neither Angel Broking Pvt. Limited, nor its directors, employees or affiliates shall be liable for any loss or damage that may arise from
or in connection with the use of this information.